Plan Overview
The overview screen of the plan displays phases, dates, cash flow opportunities, buyer leverage, average payment terms, and execution progress, with options to analyze data through charts and breakdowns for each phase, including supplier details, financing groups, harmonization groups, credit ratings, industries, and countries.
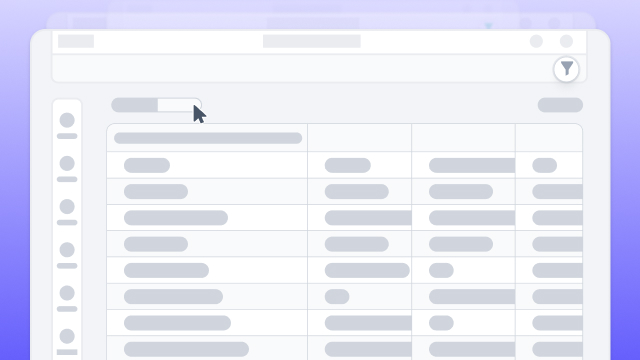
Plan Overview Screen on the ADA Platform:
- The screen provides an overview of a previously created plan.
- Displays all phases with an option to select specific phases.
- Dates for the plan are shown, set in a previous video.
Cash Flow Information:
- Cash flow opportunity and expected cash flow are presented.
- Aggregated customer expectations in the currency indicated at the top.
Buyer Level Details:
- Buyer leverage is highlighted, indicating a high level in the specific plan.
Payment Terms:
- Average payment terms are shown, both current and contractual.
- An addition of 31 days is noted in the movement towards future terms.
Plan Entities:
- The plan includes 687 parents, 2,000 spend lines, 911 suppliers, and 3 buying entities.
Execution Progress:
- The negotiation process is in progress.
- Suppliers entering new payment terms into their supplier cards affect the execution progress.
Data Analysis Options:
- The screen allows users to select charts and manipulate data.
- Different views are available, such as timeline for plan phases and cash flow opportunity.
Detailed Breakdown:
- Further details are provided by scrolling down.
- Breakdown of phases includes supplier details, financing groups, harmonization groups, credit ratings, industries, and countries.
Phases Breakdown:
- The plan consists of two phases.
- Detailed information is available on each phase, allowing for a deeper understanding.
Flexible Data Exploration:
- Users can dive into specific aspects, like supplier details and categorizations.
Future Progress Indicators:
- The execution progress is expected to move closer to its target as suppliers adopt new payment terms.
Chart Analysis:
- Charts display information, such as cash flow opportunity over different phases.
User Interaction:
- Users have the option to select and manipulate charts for a customized data analysis experience.
Comprehensive Plan Overview:
- The summary provides a comprehensive understanding of the plan, its entities, financial aspects, and execution progress.
0:01 - This is the overview screen of the plan, which was created in a previous video. We're looking at all phases up here, but you can select between viewing specific phases at the top.
0:14 - from the left and we'll move right. These are the dates which are assigned for the plan, which we did in the previous video.
0:21 - And on to the right, we see the cash flow opportunity. Also the expected cash flow. So what the customers on an aggregated level are expected to agree to volume.
0:34 - And reminder that this is always in the currency which is indicated at the top bar. over here is the buyer level.
0:41 - We see here that in this specific plan, the buyer has a very high leverage. Moving to the right. We see the average payment terms.
0:50 - What they're at currently and the contractual and where we're moving to when we see that's an addition of 31 days.
0:57 - This is the entities that are within the plans of six hundred eighty seven parents two thousand spend lines nine hundred eleven suppliers and three different buying entities.
1:07 - The last thing to the right is we see we are in the execution process. So the negotiation hasn't started here once suppliers start having new payment terms entered into their supplier cards.
1:21 - This will slowly get closer to its target and hopefully one hundred percent. Moving down. You We can select these charts and dice the data within this plane differently.
1:35 - So now we're looking at the timeline for the different phases of the plan. We can also look at this is Bye.
1:43 - We can also look at cash flow opportunity. So he's, we see here the amount on the Y axis and the different phases on the X axis.
1:52 - This. Lastly, scrolling down. We have a breakdown of the different phases here so you can dive in a little bit more to each phase.
2:12 - This specific plan has two phases. You go down to see more details and it dives into where all the suppliers fall into that are in this plan.
2:23 - So the financing groups, harmonization groups, credit ratings, industries and countries. And that is plan overview.
Up next