Compare Metrics
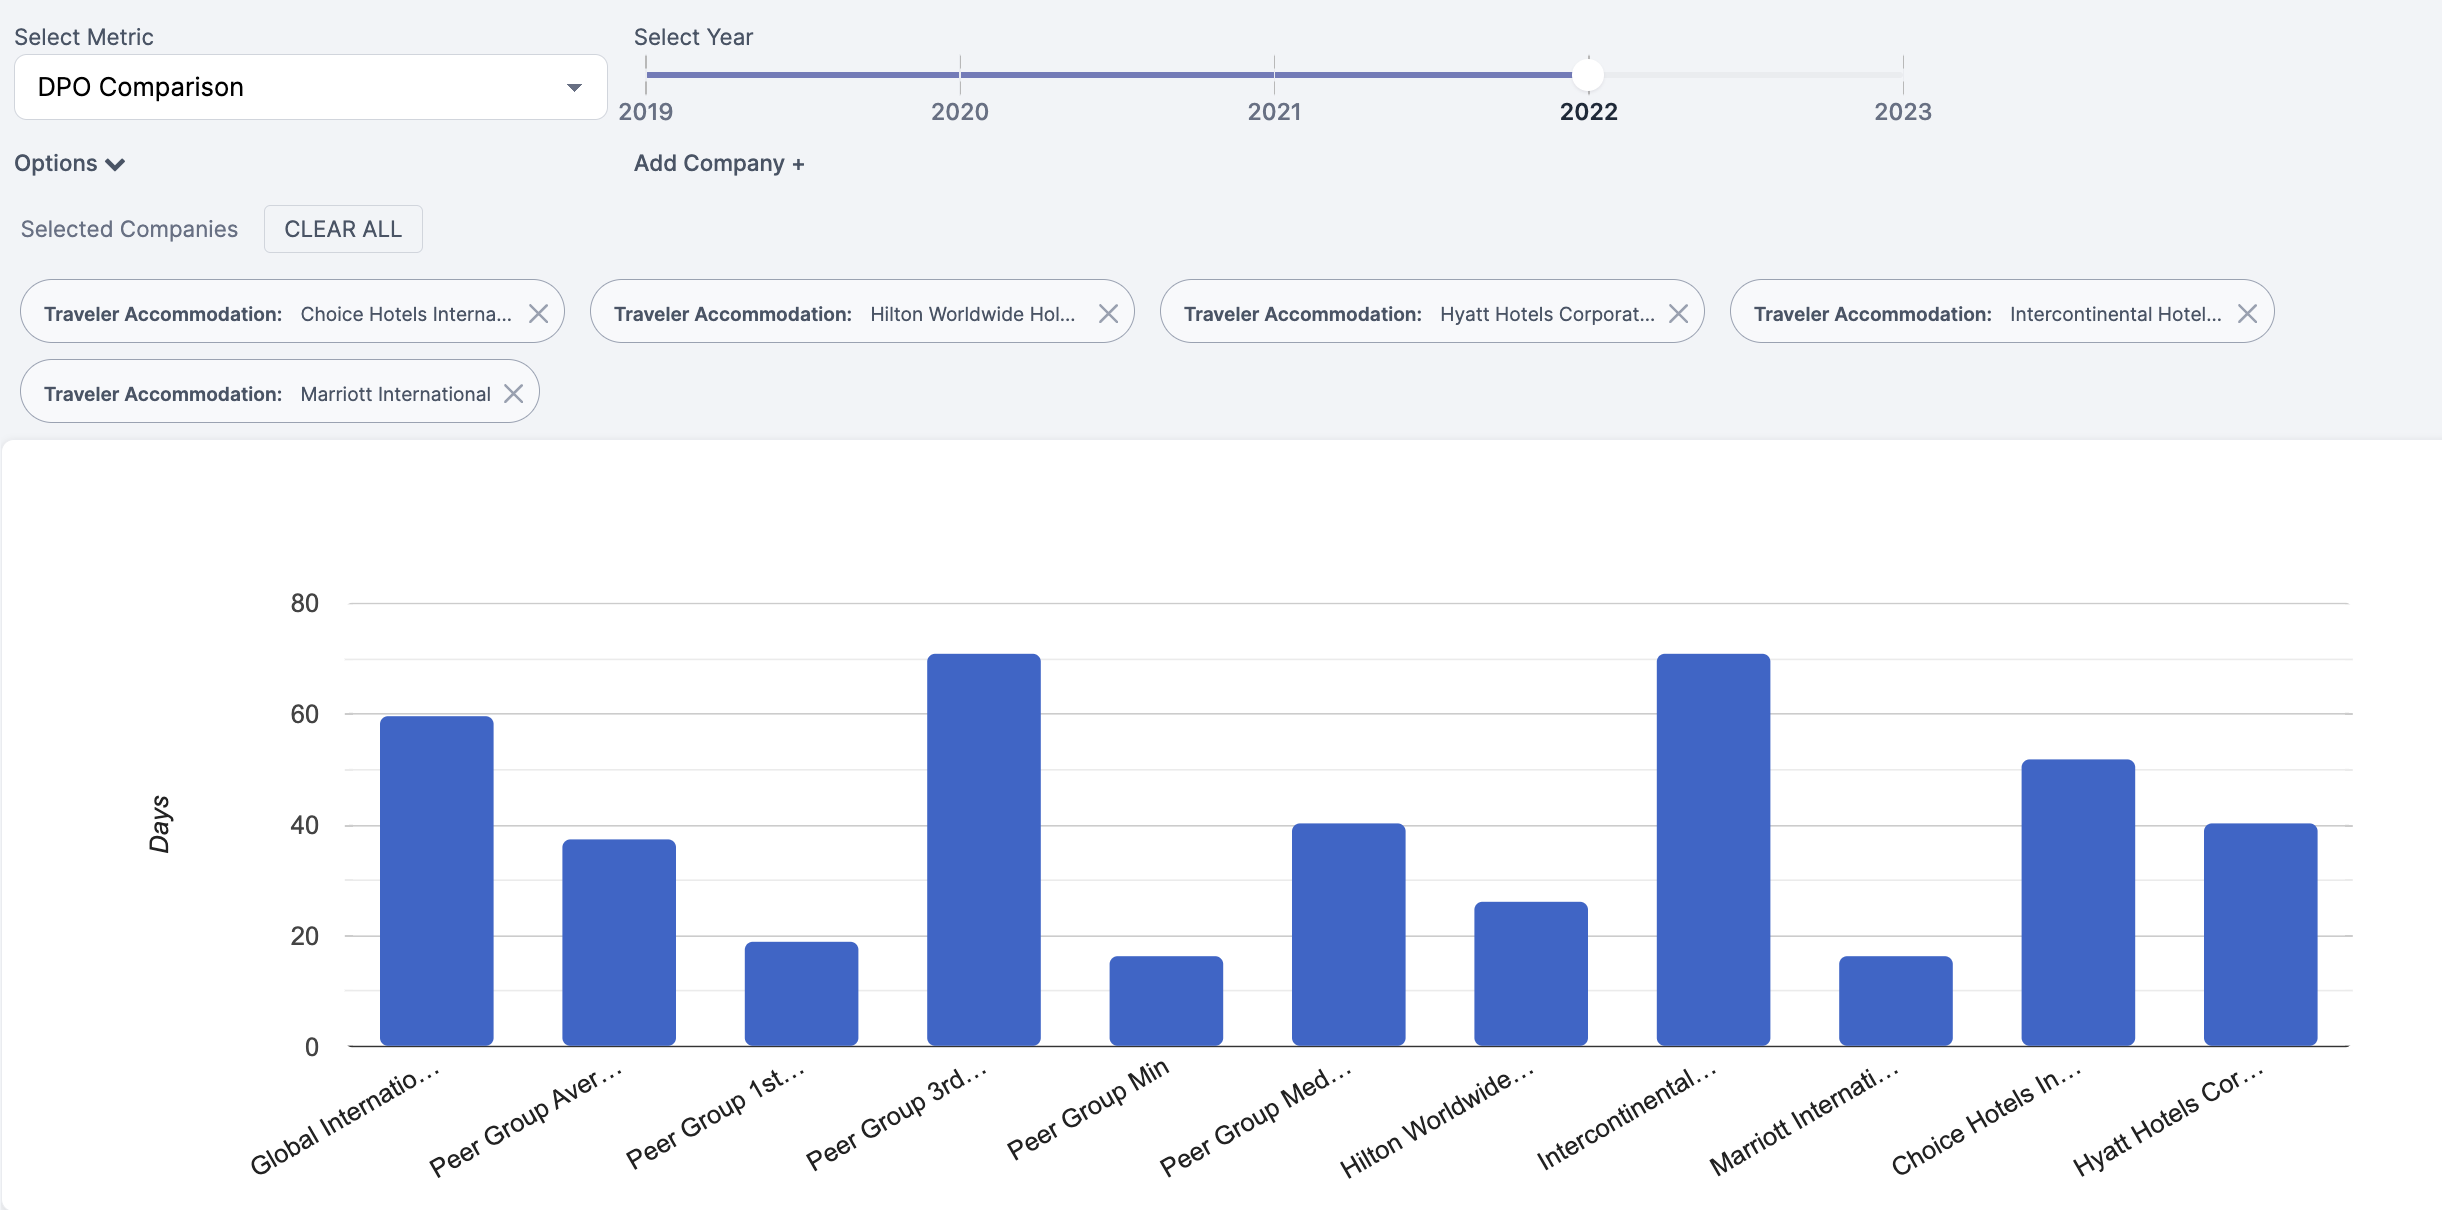
What is DPO/DSO/C2C Comparison?
The Comparison allows us to compare our company with our peer group in terms of the key working capital metrics such Days Payable Outstanding (DPO), Days Sales Outstanding (DSO), and Cash to Cash Cycle (C2C) as well as payment terms. The comparison can be done for a specific year or for multiple periods by selecting the Development in the drop down menu.
Please note:
Below the chart, the platform displays the underlying data points in a table.
If no or incorrect values are displayed in the chart for our company, you can change it in the Preferences under Financial Data.
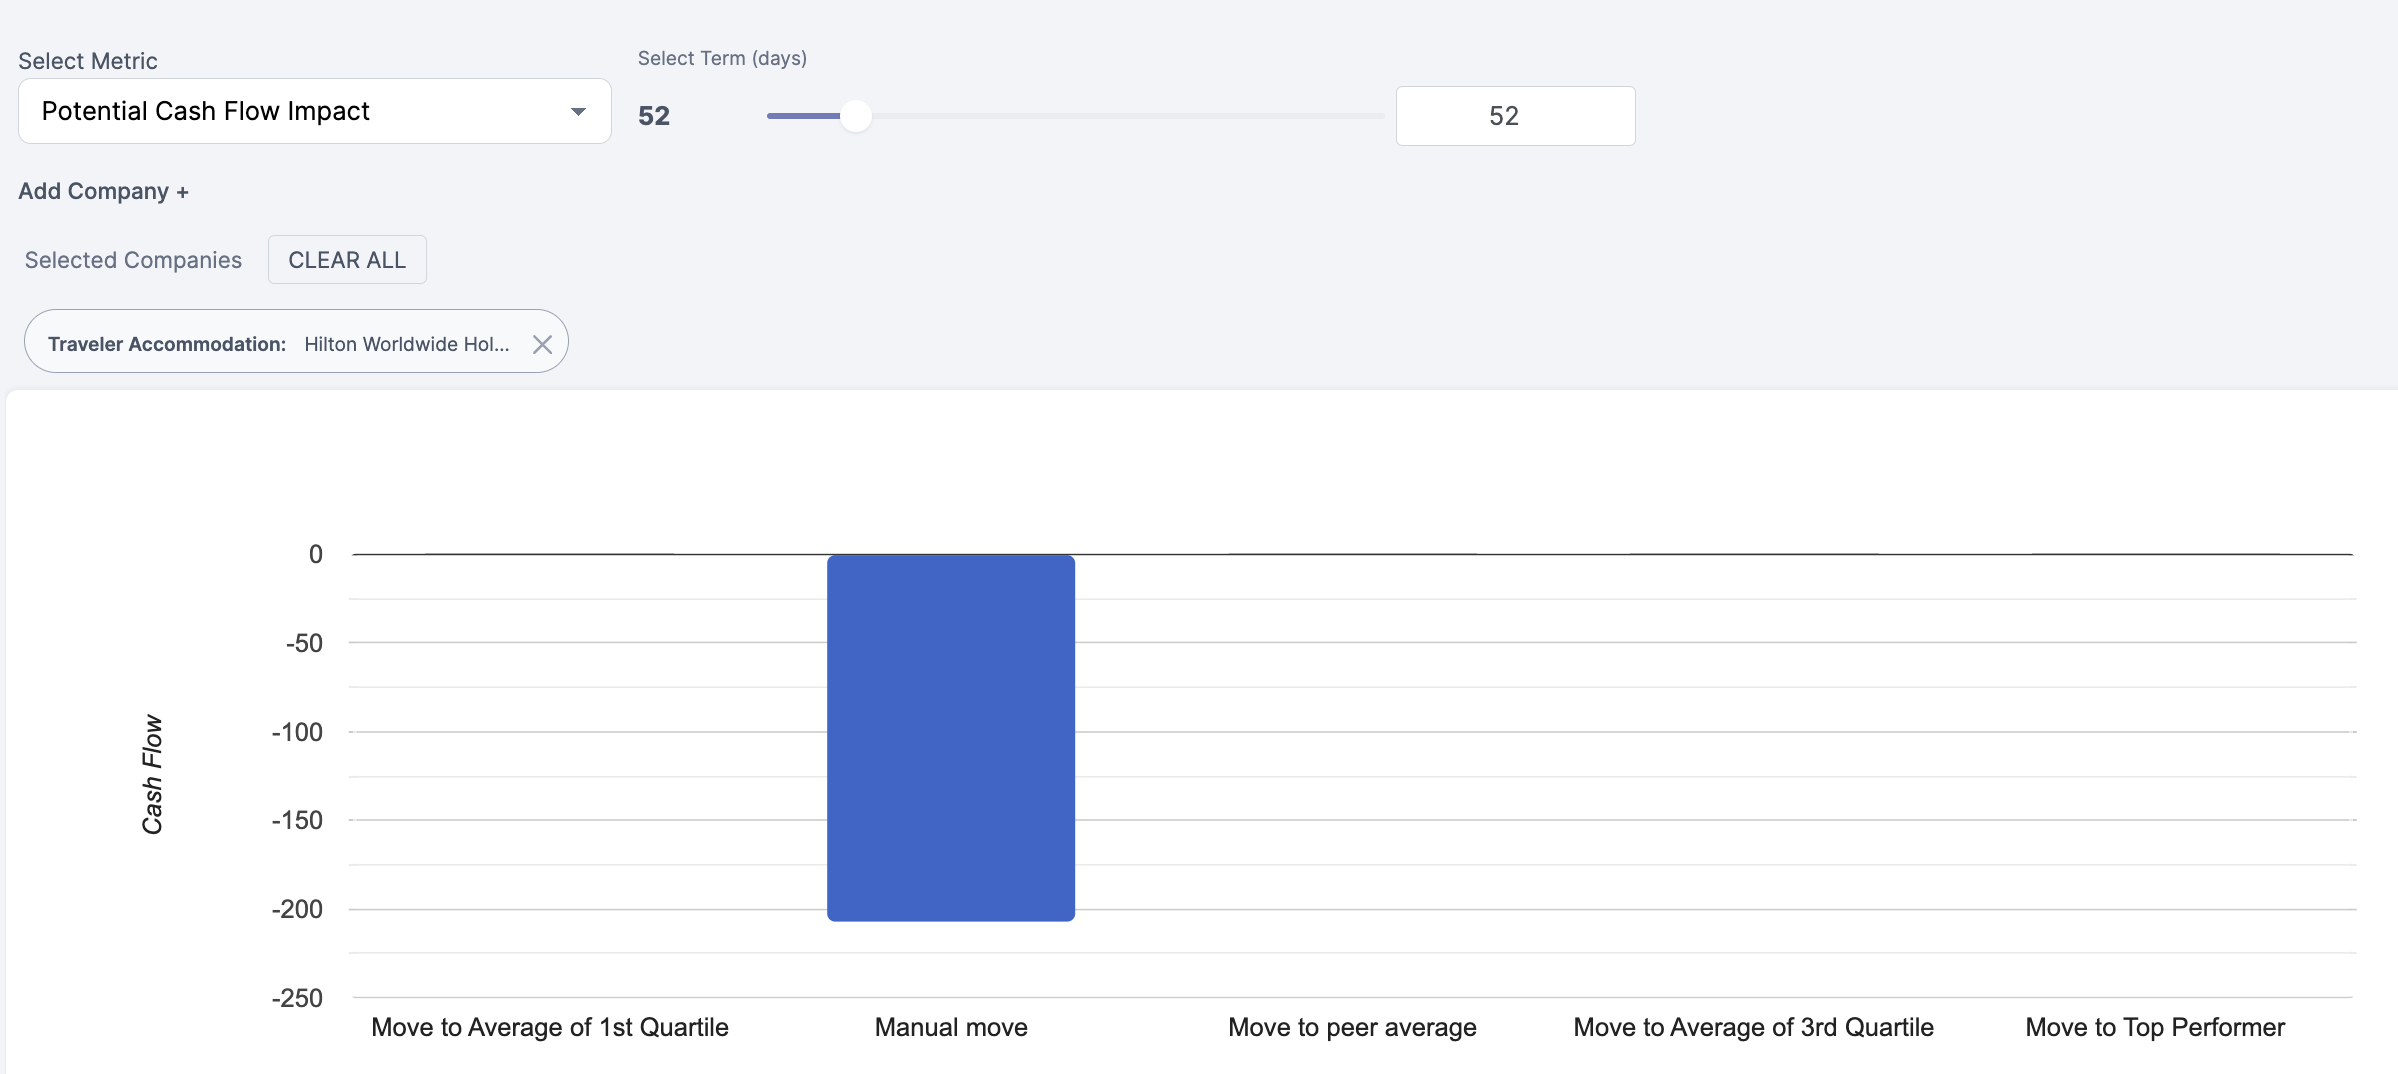
What is Potential Cash Impact?
This chart highlights the impact on our cash flow if we moved our average days paid to a specific level or to the following levels:
- 1st Quartile
- Peer Average
- 3rd Quartile
- Top Performer